import matplotlib.pyplot as plt

years = [2021, 2022, 2023, 2024, 2025]
values = [12, 15, 14, 19, 23]

plt.plot(years, values, marker="o")
plt.title("Value by year")
plt.xlabel("Year")
plt.ylabel("Value")
plt.show()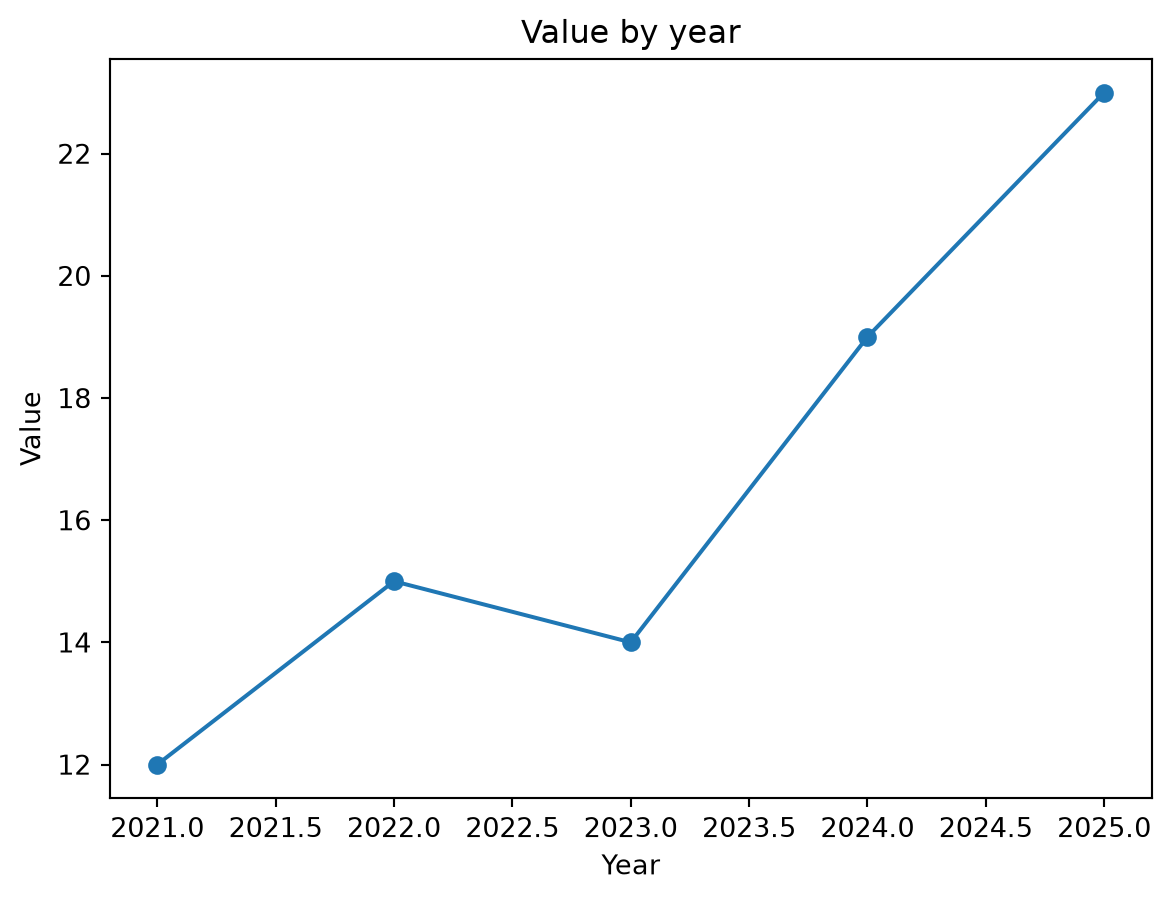
import matplotlib.pyplot as plt
years = [2021, 2022, 2023, 2024, 2025]
values = [12, 15, 14, 19, 23]
plt.plot(years, values, marker="o")
plt.title("Value by year")
plt.xlabel("Year")
plt.ylabel("Value")
plt.show()
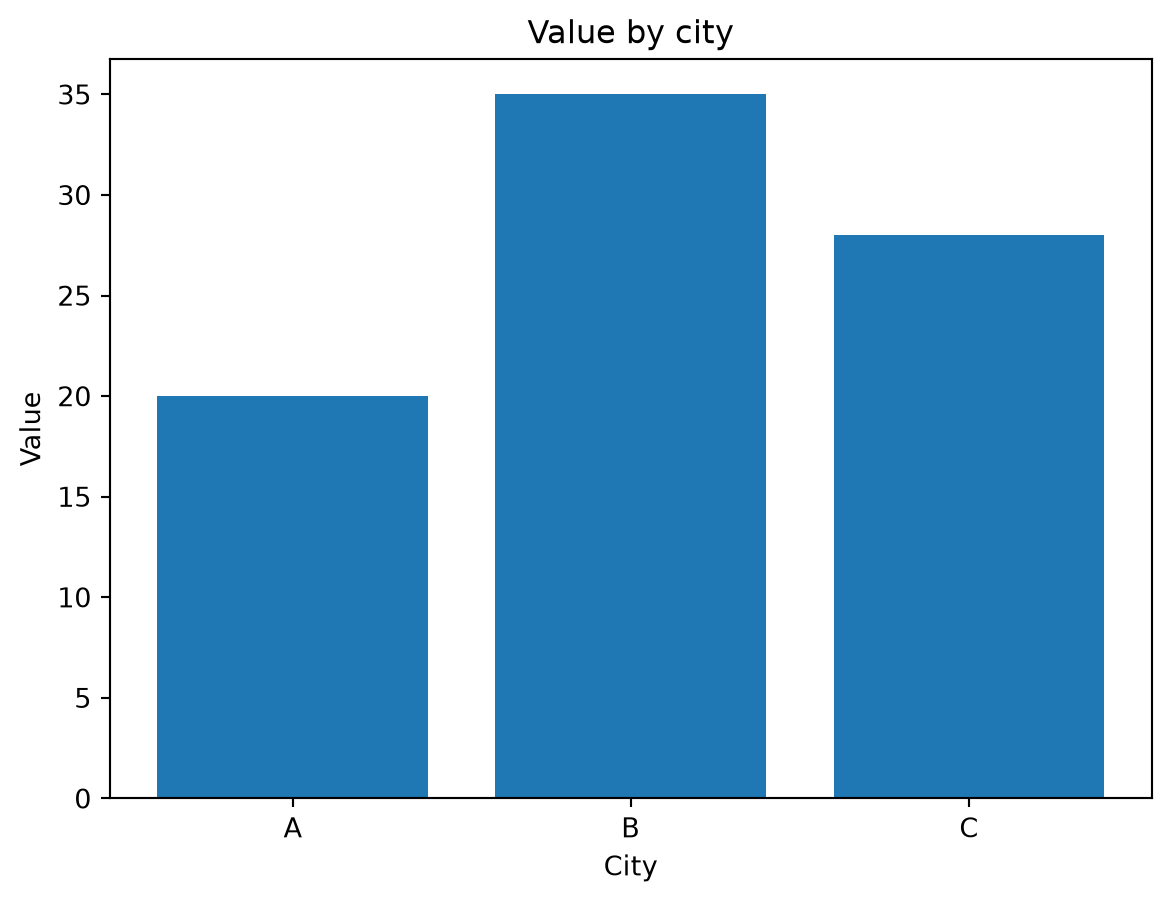
cities = ["A", "B", "C"]
values = [20, 35, 28]

plt.bar(cities, values)
plt.title("Value by city")
plt.xlabel("City")
plt.ylabel("Value")
plt.show()